Multi-omics data integration
We will perform a short integration of a proteomics and lipidomics dataset obtained for a demylination (i.e., damage to the myelin sheath surrounding neurons) experiment with four time points given by days (0, 4, 7, and 14, abbreviated by ‘d00’, ‘d04’, ‘d07’, and ‘d14’). See details of this study in [Penkert21].
We can download both datasets which are provided by xOmics as use-case datasets as follows:
import xomics as xo
df_prot = xo.load_dataset(name="PROT_DEMYLINATION")
df_lip = xo.load_dataset(name="LIPID_DEMYLINATION")
Focusing on a comparison of day 7 against day 0, we can first define all constants for our analysis:
groups = ["d00", "d03", "d07", "d14"]
args_col = dict(col_fc="log2_fc_(d07/d00)", col_pval="-log10_p-value_(d07/d00)")
# Lipidomics data were measured in pikomol using an external standard
args_lip = dict(col_id="lipid_id", col_name="lipid_name", str_quant="pmol")
# Proteomics data were measured using label free quantification (LFQ)
args_prot = dict(col_id="protein_id", col_name="gene_name", str_quant="log2_lfq")
We first perform some filtering steps and compute the fold changes for our proteomics data:
# Pre-processing
pp = xo.PreProcess(**args_prot)
pr = xo.pRank(**args_prot)
df_lfq = pp.filter_groups(df=df_prot, groups=groups)
df_lfq = pp.filter_duplicated_names(df=df_lfq, col="gene_name")
# Compute fold change (FC) and p-values
df_fc = pp.run(df=df_lfq, groups=groups, groups_ctrl=["d00"])
df_fc = pp.filter_nan(df=df_fc, cols=["log2_fc_(d07/d00)", "-log10_p-value_(d07/d00)"])
Now the threshold based significance and P-scores can be computed:
df_fc = pp.add_significance(df=df_fc, **args_col)
df_fc = pr.p_score(df_fc=df_fc, **args_col)
df_fc.head(5)
| protein_id | gene_name | log2_fc_(d03/d00) | log2_fc_(d07/d00) | log2_fc_(d14/d00) | -log10_p-value_(d03/d00) | -log10_p-value_(d07/d00) | -log10_p-value_(d14/d00) | sig_class | p_score | |
|---|---|---|---|---|---|---|---|---|---|---|
| 0 | Q8K4G5 | Ablim1 | -0.528 | -0.6825 | -0.220 | 4.230306 | 5.312642 | 3.140084 | Down | 0.340022 |
| 1 | Q91ZJ5 | Ugp2 | -0.036 | -0.2850 | -0.518 | 0.248030 | 4.640008 | 6.791086 | Unchanged | 0.246418 |
| 2 | P53986 | Slc16a1 | -0.084 | -0.4410 | -0.806 | 0.317540 | 3.634130 | 6.823463 | Unchanged | 0.228351 |
| 3 | P24270 | Cat | -0.186 | -0.7560 | -0.384 | 1.586811 | 5.169079 | 4.096977 | Down | 0.345767 |
| 4 | Q99KC8 | Vwa5a | -0.352 | -0.7130 | -1.056 | 1.420013 | 4.742200 | 7.742758 | Down | 0.320359 |
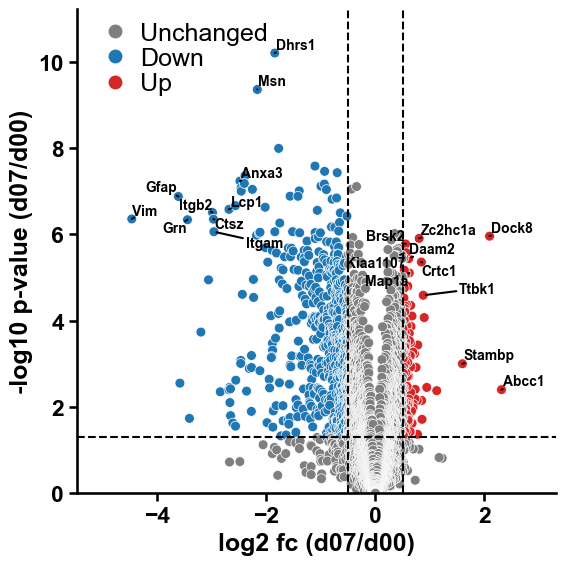
We use this to highlight the proteins with the strongest proteomic signal in a volcano plot
import matplotlib.pyplot as plt
df_fc = df_fc.sort_values(by="p_score", ascending=False)
top_genes_up = df_fc[df_fc["sig_class"] == "Up"]["gene_name"].to_list()[0:10]
top_genes_down = df_fc[df_fc["sig_class"] == "Down"]["gene_name"].to_list()[0:10]
top_genes = top_genes_down + top_genes_up
xo.plot_settings()
xo.plot_volcano(df=df_fc, **args_col, names_to_annotate=top_genes, col_names="gene_name")
plt.tight_layout()
plt.show()
We can now obtain the significantly altered proteins and perform a gene
set enrichment analysis using
g:Profiler <https://biit.cs.ut.ee/gprofiler/gost>_ with default
settings and using all Gene Ontology and biological pathways data
sources. A list of ‘target_genes’ has to be provided, and it is highly
recommended to use a customized ‘background’ by setting in ‘Advanced
options’ the ‘Statistical domain scope’ to ‘Custom’ and copy-pasting
your entire list of detected proteins.
background = df_fc["gene_name"].to_list()
target_genes = df_fc[df_fc["sig_class"].isin(["Up", "Down"])]["gene_name"].to_list()
print(f"Target list comprises {len(target_genes)} genes, which is a subset of the complete background list including {len(background)} genes.")
Target list comprises 644 genes, which is a subset of the complete background list including 4526 genes.
Run g:Profiler und download the ‘Detailed Results’ as GEM and convert
the .txt file into a .tsv file. We provide the results of this
enrichment analysis as use-case by using xo.load_dataset and setting
name='gProfiler_DEMYLINATION':
df_gprof = xo.load_dataset(name="gProfiler_DEMYLINATION")
df_gporf = pp.apply_log(df=df_gprof, cols=["p.val"], log2=False, neg=True)
df_gprof.head(5)
| go.id | description | p.val | fdr | phenotype | genes | |
|---|---|---|---|---|---|---|
| 0 | GO:0003735 | structural constituent of ribosome | 2.875376e-09 | 2.875376e-09 | 1 | RPL18,RPL27,RPL5,RPL27A,RPS28,RPL29,RPS14,MRPL... |
| 1 | GO:0003779 | actin binding | 2.727871e-04 | 2.727871e-04 | 1 | DAAM2,ANLN,MRTFB,ADCY8,PHACTR1,MAP1A,ABLIM1,CO... |
| 2 | GO:0005198 | structural molecule activity | 4.333399e-02 | 4.333399e-02 | 1 | CRYAB,PLLP,MAP1A,RPL18,RPL27,H4C1,CD2AP,RPL5,R... |
| 3 | GO:0002181 | cytoplasmic translation | 9.007092e-05 | 9.007092e-05 | 1 | RPL18,RPL27,HNRNPU,RPL5,YBX1,RPL27A,RPS28,NMNA... |
| 4 | GO:0042274 | ribosomal small subunit biogenesis | 6.388875e-04 | 6.388875e-04 | 1 | RPS28,RPS14,RPS8,RPS13,RPS24,RPS3A,RPS5,RPS12,... |
These enrichment results can be used to obtain a protein-centric enrichment-based ranking score called E-score:
# TODO
To perform an enrichment analysis for the lipidomics data, we obtain as
well all significantly changed lipids and use this time
LION/web server <http://www.lipidontology.com/>. The results are
provided by xOmics by using xo.load_dataset with
name='LION_DEMYLINATION':