xomics.plot_gcfs
- xomics.plot_gcfs(option='font.size')[source]
Gets current font size (or axes linewdith).
This font size can be set by
plot_settings()function.Examples
Here are the default colors used in CPP and CPP-SHAP plots:
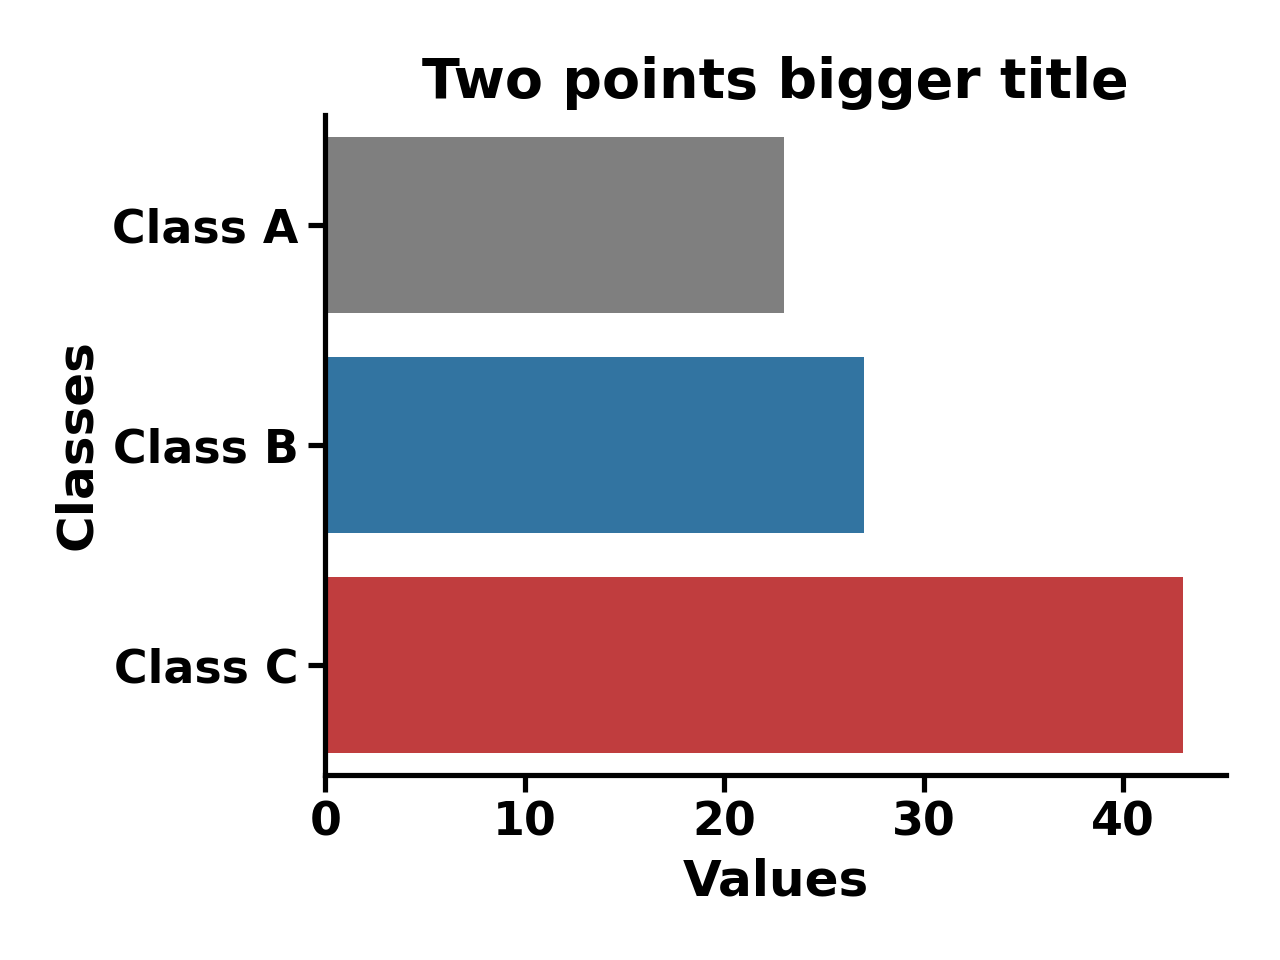
>>> import matplotlib.pyplot as plt
>>> import seaborn as sns
>>> import xomics as xo
>>> data = {'Classes': ['Class A', 'Class B', 'Class C'], 'Values': [23, 27, 43]}
>>> colors = xo.plot_get_clist()
>>> xo.plot_settings()
>>> sns.barplot(y='Classes', x='Values', data=data, palette=colors, hue="Classes", legend=False)
>>> sns.despine()
>>> plt.title("Two points bigger title", size=xo.plot_gcfs()+2)
>>> plt.tight_layout()
>>> plt.show()
(
Source code,png,hires.png,pdf)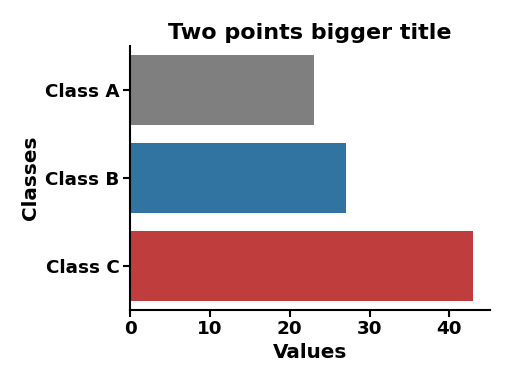
See also
Our Plotting Prelude.